
How a Nobel Prize–winning volatility model, a few AI prompts and a free desktop app can tell you how far Nifty may move tomorrow, next week or next month.
If you have only ever read the market through red and green candles, Supertrend and RSI, there is a whole layer of mathematics working behind every candle. Banks, hedge funds and proprietary trading desks around the world use it every day. In this guide you will learn what that model is, why it works, and, step by step, how to run it yourself on Nifty and on the 50 stocks of the index, without writing a single line of maths.
Educational use only. Everything in this article is a study of a textbook model on past data. It is not investment advice, not a recommendation and not a forecast of where Nifty will go. The model never predicts direction and cannot see news.
1. What is the GARCH model?
Every trader asks the same basic question: how far can the market move tomorrow? Nobody can tell you where Nifty will go. But how far it can move is a question a mathematical model can answer, and that is exactly what GARCH does.
The core idea: forget direction, estimate the size of tomorrow’s move.
GARCH stands for Generalised AutoRegressive Conditional Heteroskedasticity. It is a formula that predicts tomorrow’s volatility from today’s. The person who built it won the Nobel Prize for it, and the whole model fits in a single equation:
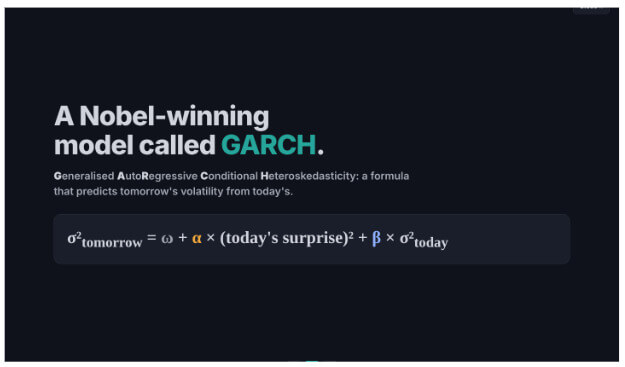
The complete model in one line: tomorrow’s variance is built from a base level (ω), today’s surprise (α) and today’s variance (β).
Do I need to understand the maths?
No. Behind every candle there is mathematics, but you do not have to work through it by hand. You need to understand what the model does and where it fails. Once you understand that, you can ask an AI assistant to implement the model for you, which is exactly how this software was built (see section 7).
What does the model output?
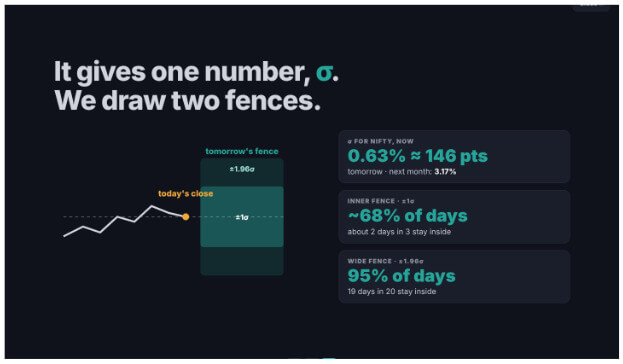
Each time the equation is run, it produces one number, called sigma (σ). Sigma tells you the size of the move to expect tomorrow. Starting from today’s close, Nifty can move up by roughly that much, or down by roughly that much.
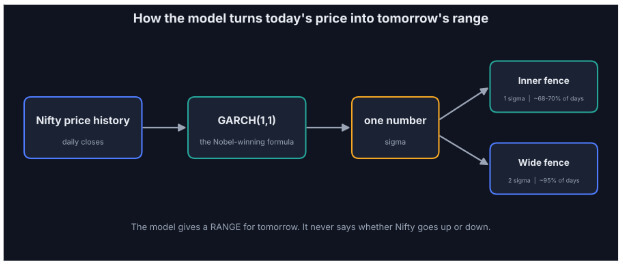
From price history to a range: GARCH turns past prices into a single number, sigma, which is then drawn as two fences.
2. The two fences: 1 sigma and 2 sigma
The software draws sigma as two boxes (“fences”) around tomorrow’s expected close.
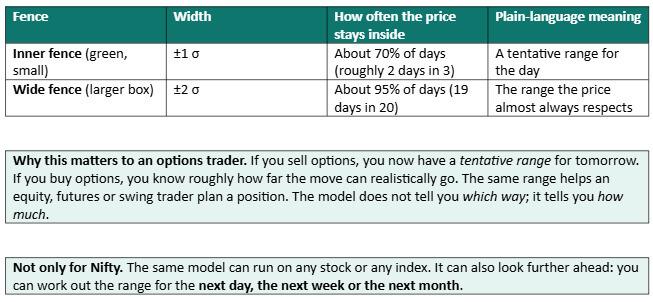
The inner fence is ±1σ, the wide fence is ±2σ (about ±1.96σ in the software).
3. See it for yourself: the visual back-test
Instead of building an Excel sheet full of numbers, the software shows the idea visually. It replays past candles as if the market were live and draws the model’s fences for each day. You can then watch whether the real price respects them. In other words, you are back-testing the entire idea with your own eyes.
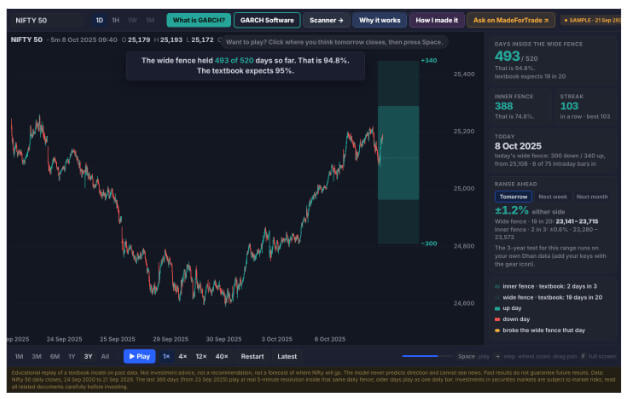
The replay chart. The green block on the right is tomorrow’s fence. The scoreboard on the right counts how many days the price stayed inside. (Bundled sample data.)
Let the replay run for a minute or two and watch: roughly 70% of the time the price stays inside the small box, and roughly 95% of the time it stays inside the big one.
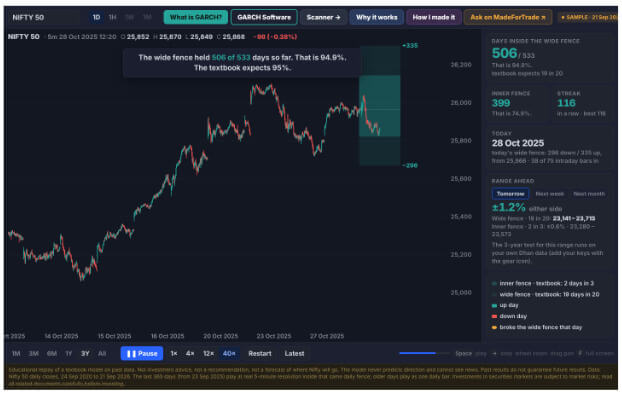
After the replay has run for a while the scoreboard settles close to the textbook numbers: the wide fence held 506 of 533 days (94.9%).
What the scoreboard showed in the video
In the video’s run, the model was tested on 567 days of data it had never seen:
- The price was inside the inner (first) fence about 75% of the time (429 times).
- It was inside the wide fence about 95% of the time.
- At one point Nifty stayed inside the predicted range 26 days in a row.
4. Step-by-step: how to use the software
Follow these steps in order. Each one explains what to do, why, how it works and what you should see.
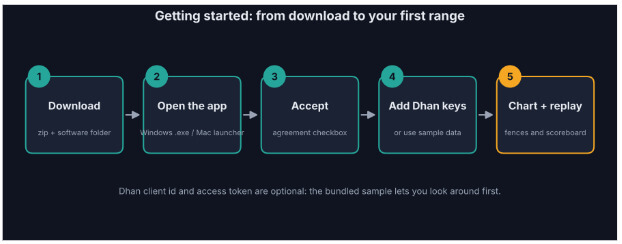
The whole journey on one page.
Step 1: Download the software
- What to do: Download the zip file (link in the Resources section) and unzip it.
- Why: The finished app, its source code and the research files all come in this one pack.
- How it works: The software folder contains one ready-to-run file per system, with no installation and no extra programs needed.
- Expected result: You see files for Windows (.exe), Mac (a launcher plus Apple-chip and Intel versions) and Linux.
Step 2: Open the app
On Windows
1. Double-click garch-volatility-windows-amd64.exe.
2. A console window opens. Leave it open while you use the app; closing it stops the app.
3. Your browser opens the app automatically.
Note: Windows SmartScreen may warn about an unsigned app. Click More info, then Run anyway.
On a Mac
1. Open the software folder and right-click Start-on-Mac.command.
2. Choose Open, then Open again. You only need to do this the first time.
3. A Terminal window opens and your browser opens the app. Leave Terminal open; close it to stop the app.
Tip: The Mac launcher picks the right file (Apple chip or Intel) by itself. If macOS still refuses, go to System Settings → Privacy & Security → Open Anyway. The README inside the zip lists the manual Terminal commands too.
- Why a console window? The app runs a small private server on your own computer (localhost). Nothing is uploaded anywhere.
- Expected result: A browser tab opens at http://localhost:8766 showing the agreement page.
Step 3: Read and accept the agreement
- What to do: Read the short agreement, tick “I have read and understood the agreement and accept it in full”, then click I agree (the button stays disabled until the box is ticked).
- Why: It tells you plainly what the tool is: an educational tool, not advice, and the software never places an order.
- Expected result: You move on to the setup page.
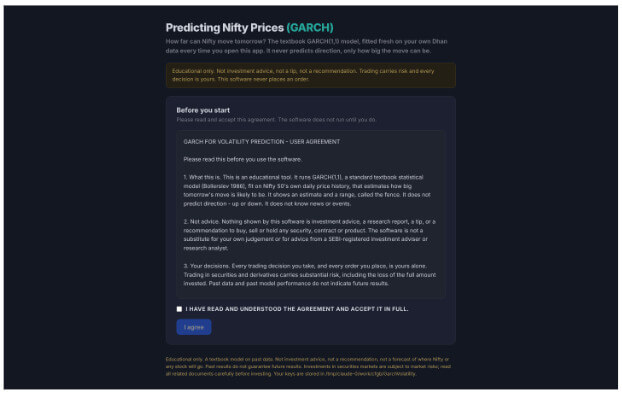
Before you start: the agreement page.
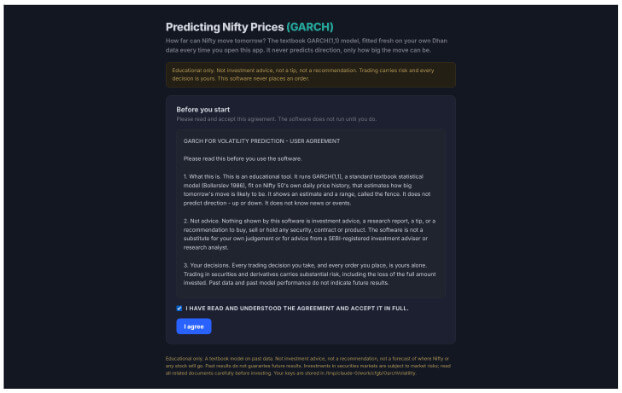
Tick the box and the I agree button becomes active.
Step 4: Add your Dhan keys, or look around with sample data
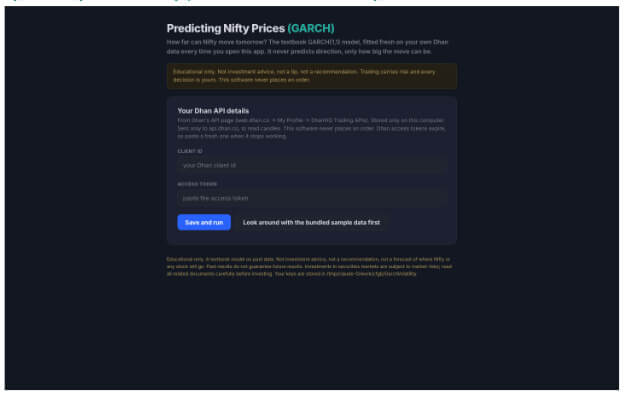
The setup page: enter your Dhan details, or try the bundled sample data first.
You have two choices:
- Use your own data (recommended): Enter your Dhan client id and access token (from Dhan’s API page) and click Save and run.
- Why: The app pulls the latest Nifty candles and the 50 stocks, refits the model and re-runs the honest back-test, so the chart, replay and scanner end on the latest close.
- How it works: Only the client id and token are needed. The app does the rest. Your keys are saved only on your computer and sent only to Dhan’s API (api.dhan.co). The app only reads candles and never places an order.
- Look around first: Click “Look around with the bundled sample data first”. This works without any keys, so you can explore every screen right away.
Warning: Dhan access tokens expire. When data stops refreshing, open the gear icon on the chart page and paste a fresh token. You can change your client id and token at any time.
- Expected result: The chart page opens. With your own keys it shows a LIVE tag in the top bar; with saved data SAVED; with the sample SAMPLE.
Step 5: Read the chart
- What to do: Look at the green block at the right edge of the chart. It is tomorrow’s fence, drawn from the latest close.
- Why: This is the answer to the question “how far can Nifty move tomorrow?”
- How it works: The inner block is ±1σ and the lighter outer block is ±2σ. The numbers on the block (for example +301 / −273) show the distance in index points from the last close.
- Expected result: A headline such as “For the next trading day … the model’s fence puts Nifty’s close between 23,141 and 23,715. Which way, it cannot say.”
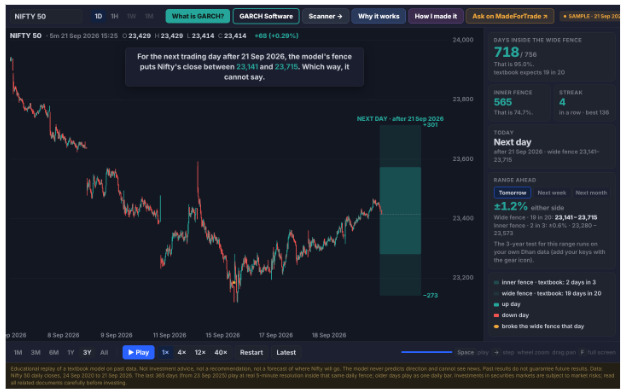
The latest day: the Range ahead card on the right gives the expected move as a percentage, and the wide and inner fence in index points.
Use the Range ahead card to switch between Tomorrow, Next week and Next month. Click Latest at the bottom to jump back to the newest day at any time.
Step 6: Replay the past and watch the fences work
- What to do: Press Play (or the space bar). Choose a speed of 1×, 4×, 12× or 40×. Restart starts the replay from the beginning.
- Why: Watching the model make a forecast each evening and then seeing the next day land is the most convincing back-test, because you see how the idea would have behaved in real life.
- How it works: Every day the model draws a fence for the day ahead. The day then plays out candle by candle, and the scoreboard counts whether it landed inside the fence.
- Expected result: The scoreboard climbs: roughly 70% of days inside the inner fence and about 95% inside the wide fence.
You can also click on the chart where you think tomorrow will close, then press Space, to see how your own guess compares with the model’s range.
Step 7: Switch the timeframe
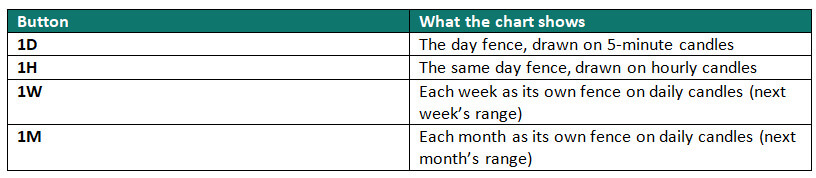
The buttons at the top of the chart (1D, 1H, 1W, 1M) change what each candle represents.
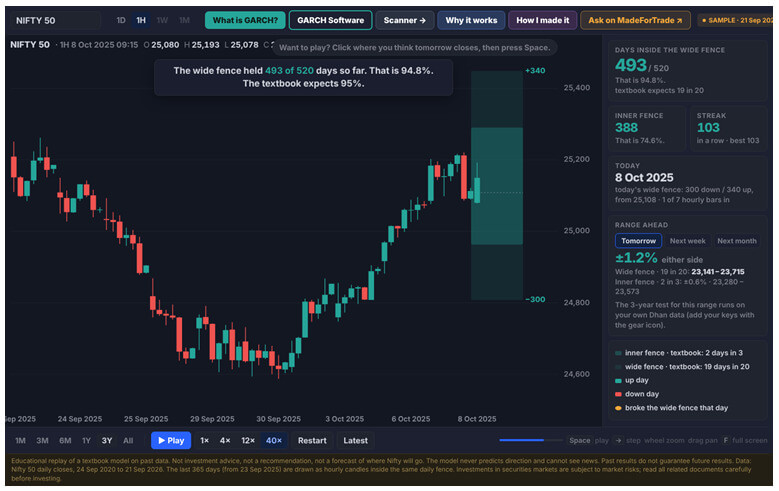
The 1H view: the same daily fence drawn over hourly candles.
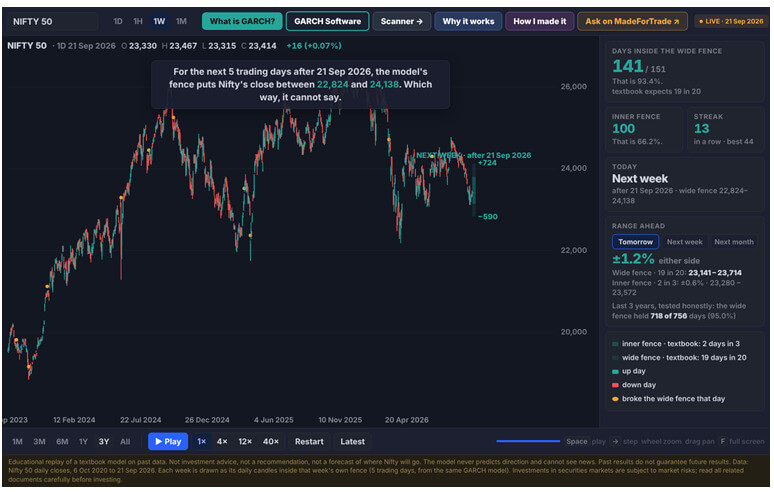
The 1W view: each week is drawn as its own fence, and the card shows the range for the next 5 trading days.
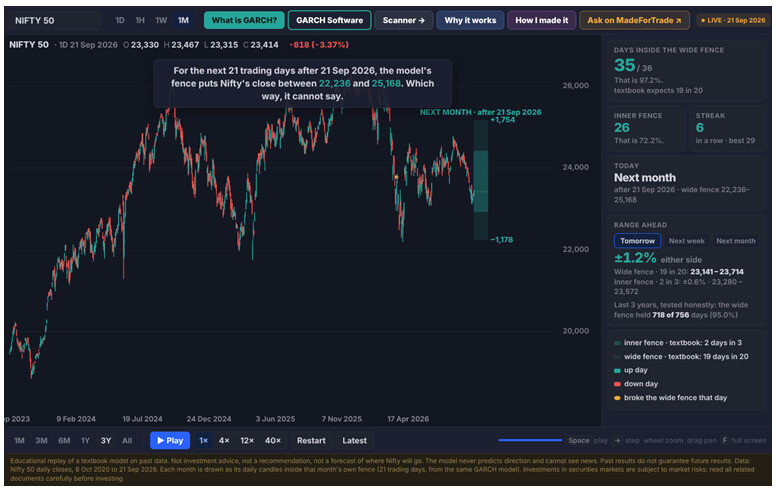
The 1M view: the range for the next month (about 21 trading days).
Note: 1D and 1H work with the bundled sample. 1W and 1M need your own Dhan data, because they are built from your own daily history. They stay greyed out in the sample.
Step 8: Use the scanner for stocks
- What to do: Click Scanner in the top bar.
- Why: The model works on any stock, so one table can show tomorrow’s range for every Nifty 50 constituent at once.
- How it works: The scanner fits the same GARCH model to each stock and lists the inner fence and wide fence for tomorrow, next week or next month. You can search for a stock, pick the horizon and sort by the widest expected move.
- Expected result: A table with each stock’s last close, expected move, wide fence, inner fence and the price range of the fence.
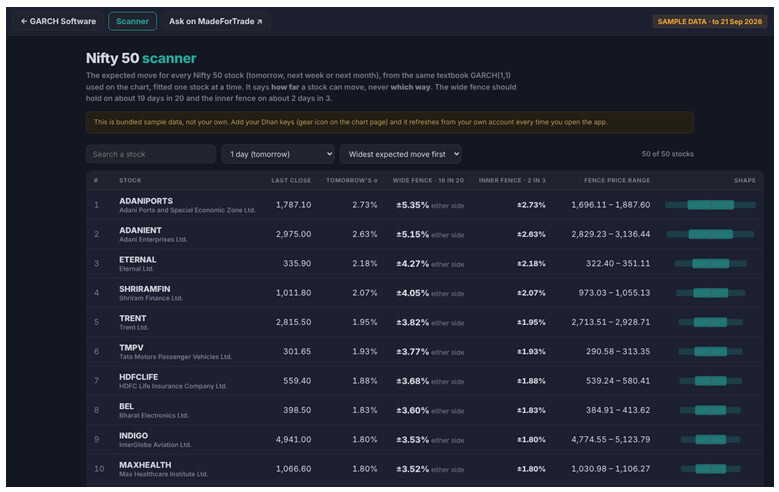
The scanner: today’s inner and wide fence for each stock. (Bundled sample data.)
5. Why does the model work?
The model works because of three simple ideas that are built into its equation. You can see each one in the Why it works slides inside the software.
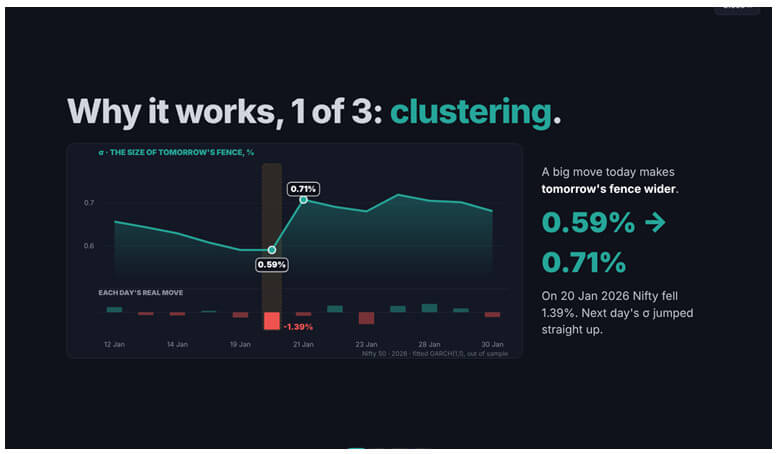
Idea 1: Volatility clustering
If today was volatile, tomorrow is likely to be volatile too. After a big move, the model widens the next day’s fence. In the example from the video, the market fell 1.39% on 20 January 2026, and the next day’s expected move jumped (0.59% to 0.71% in the slide below).
Idea 1, clustering: a big move today makes tomorrow’s fence wider.
Idea 2: Fading back
If nothing new happens, the extra volatility calms down day by day. Suppose Nifty makes a big move on an election day and then nothing happens for a month: volatility drops slowly, day after day. In the slide, an expected move of 1.74% had already faded to 1.22% ten trading days later.
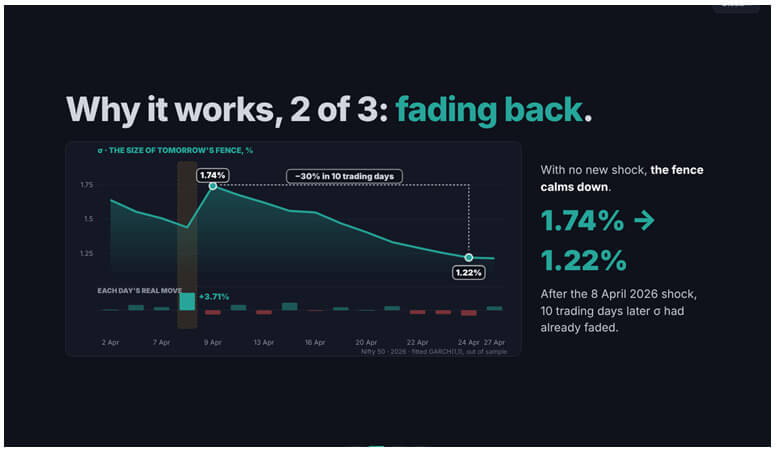
Idea 2, fading back: without a new shock, the fence narrows again.
Idea 3: The half-life
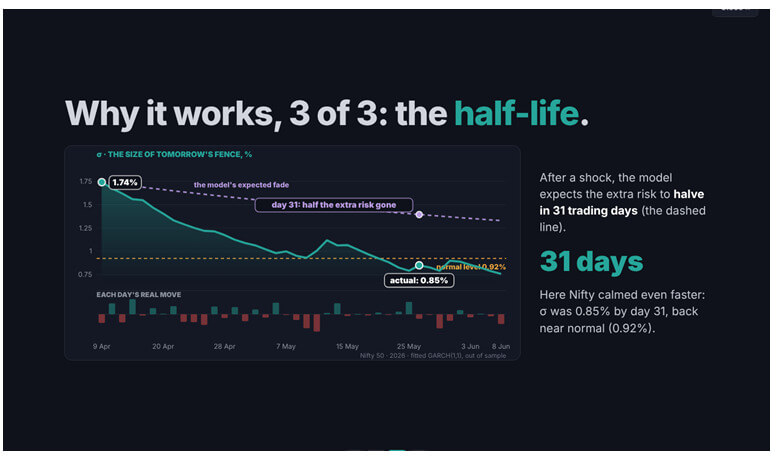
Every burst of volatility has a half-life. Think of a human life: if we live about 80 years, our “half-life” is about 40. In the same way, for Nifty the half-life of volatility is about 31 trading days: after 31 days, half of the extra volatility is gone.
Idea 3, the half-life: the extra risk halves in about 31 trading days.
These three ideas, clustering, fading back and the half-life, are what let the model give a range that holds about 95% of the time.
A 40-year-old idea that every risk desk uses
This is not a new model. It was developed about 40 years ago, and it won the Nobel Prize in Economics in 2003. Prizes of that kind are not given lightly. Today banks use models like this to price volatility and decide where to sell and where to hedge. Hedge funds, proprietary desks, market makers and other large institutions rely on the same family of ideas.
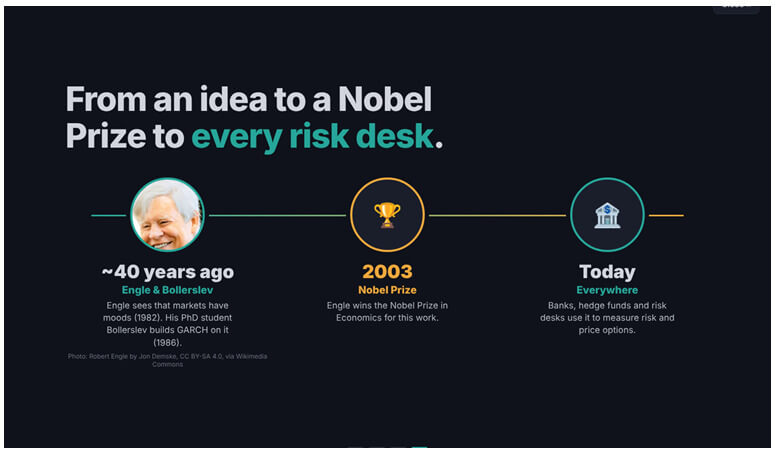
From an idea, to a Nobel Prize, to every risk desk.
6. The honest limitation: when the model fails
About 95% of the time the price stays inside the wide fence. That also means about 5% of the time it does not.
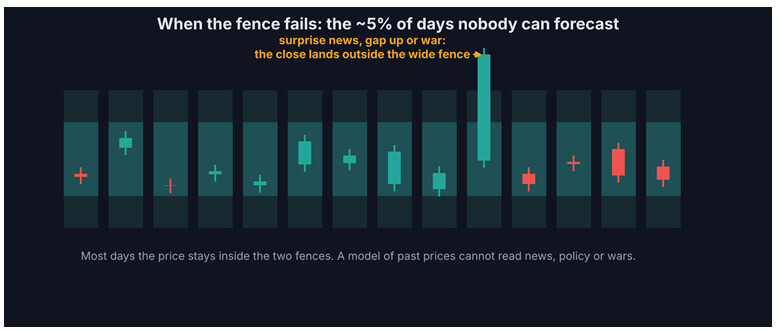
On a surprise day, a big gap up, a gap down, a war or an unexpected announcement, the close can land well outside the fence.
Warning: The model cannot predict news, government policy or wars. Those things are driven by events, not by past prices. Maths can predict ranges. It cannot predict wars. That is the model’s limit, and you should know it for every model, indicator and strategy you use: where it works, and where its failure points are.
A fence that is broken is also useful information: on the next day, the model automatically widens the fence, because volatility has just increased (Idea 1 above).
7. How this software was built (with AI)
You do not have to build anything yourself, but understanding the process helps you apply the same approach to other ideas in your own market research.
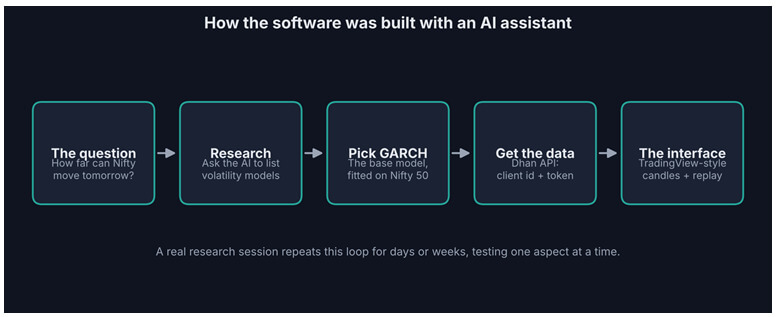
The build, from question to finished software.
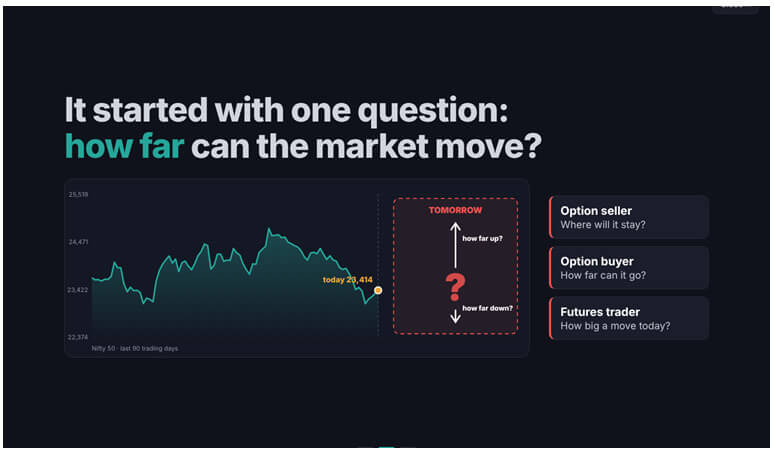
It started with one question, and the answer helps option sellers, option buyers and futures traders alike.
- Start with one clear question. Here it was: how far can Nifty move tomorrow, up or down? If you can answer that, you can use it in many strategies: selling options, buying options, trading equity or futures, or swing trading.
- Ask an AI assistant to research the models. Banks and hedge funds do not publish their strategies, but they do publish their findings and research methods. The prompt was simply: “I need a volatility prediction model. How can market volatility be predicted? List the main models.” The AI came back with about five or six well-known models, for example GARCH, EWMA (used by JP Morgan), historical volatility and implied volatility (India VIX). Many have variants: after GARCH came EGARCH and GJR-GARCH, much as Supertrend has several variations.
- Pick the base model first. Start with the standard GARCH definition and fit it on Nifty 50 before trying variations.
- Give the AI the data. A model needs data. The software uses the Dhan API and Dhan HQ skills. All you provide is your client id and access token; the AI connects to Dhan and collects the data itself.
- Ask for a chart you understand. The AI reported values like alpha and beta, but traders think in charts. So the next prompt was to build a TradingView-style chart with candles, create a replay so I can watch it like a movie, and draw the GARCH fences on top. That is how the software you just used came into being.
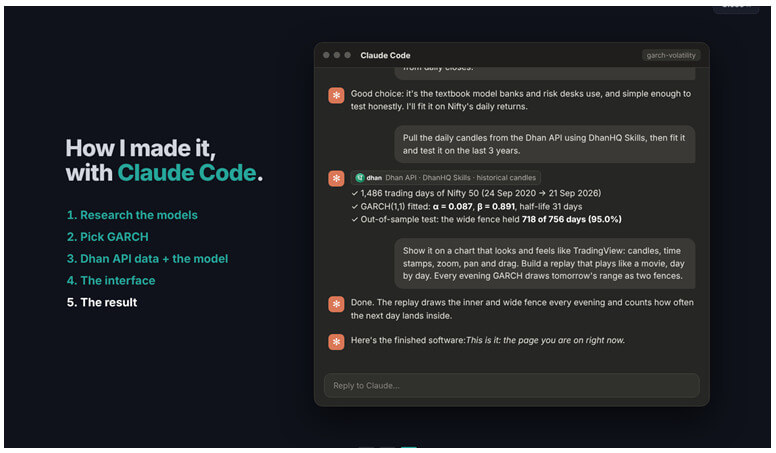
The five build steps, as a conversation with an AI assistant. Claude was used here, but any AI assistant can work.
Tip: The process above is a high-level view. Real research takes much longer. The author sits with a topic for a week or two at a stretch and tests different aspects one at a time. Be patient and keep iterating.
8. Everything you saw is yours
The software, the code and every prompt used to build it, plus a reading list of the papers and documents behind the model, are all shared, so you can reproduce the work and go deeper.
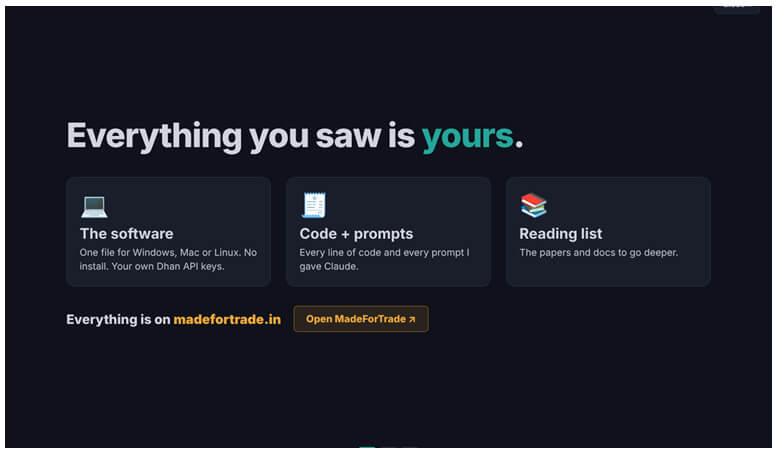
The software, the code and prompts, and the reading list are all part of the pack.
Wider lesson: Open, High, Low, Close and volume are only the beginning. Institutions in the US, China and India alike use far more than candles. If you follow the footprints of hedge funds and institutions, and learn from their publications and ideas, you will find methods that actually work, and you will see the effect in your own results.
Resources
- YouTube video: https://youtu.be/5bkXepNz-Qc?si=6b06KUGFXp006c9O
- Download (Drive link):https://drive.google.com/drive/folders/1JYq8zjn7q3Vw4RpN9RwkXa4eSqycD8_7?usp=drive_link
Mac users: the zip also includes a Mac version and a README with step-by-step instructions on how to run it on a Mac.
Summary
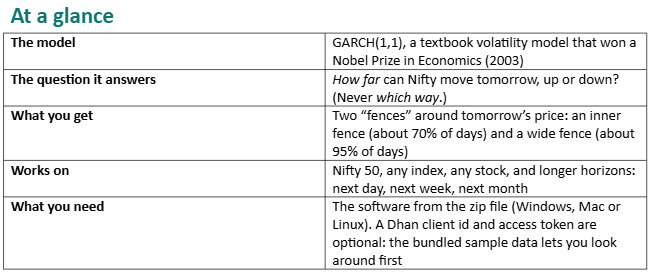
- GARCH is a Nobel Prize–winning volatility model. It outputs a single number, sigma (σ), which tells you how far Nifty can move.
- The software draws sigma as two fences: inner (±1σ, about 70% of days) and wide (±2σ, about 95% of days).
- It works on Nifty, any stock or index, and for the next day, next week and next month.
- It works because of volatility clustering, fading back and a half-life of about 31 trading days.
- About 5% of days fall outside the wide fence: news, gaps and wars are beyond any maths model.
- To use it: open the app, accept the agreement, add your Dhan client id and access token (or use the sample), then read the chart, replay it and use the scanner.
Investments in the securities market are subject to market risk. Read all related documents carefully before investing. This article is for education only and is not investment advice.